Introduction
Stanzen Engineering increased the operational efficiency of their entire plan by 30% using our Industrial IoT Gateways and Lucrys Analytics.
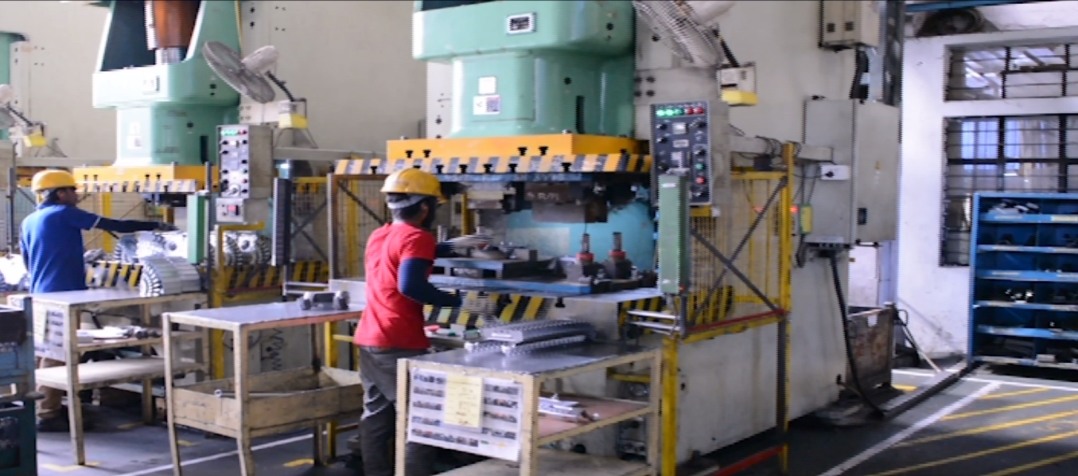
SStanzen Engineering is one of the leading players in automotive stamping and related solutions. In their three decades of operating in the industry, they have satisfactorily fulfilled hundreds of projects involving body, chassis, assembly, and safety standards. Their range of solutions includes pressing, welding, assembling, and tooling.
Their Objective
Stanzen Engineering aimed to be able to monitor all the production details in real-time. Their machines are from various manufacturers and had different legacy-based controllers and communication protocols. Due to diverse suppliers and protocols, the required information was either scattered over multiple platforms or unavailable.
Our Solution
They needed one platform that could communicate with machines of different makes, controllers, and communication protocols and compile all the necessary production details.
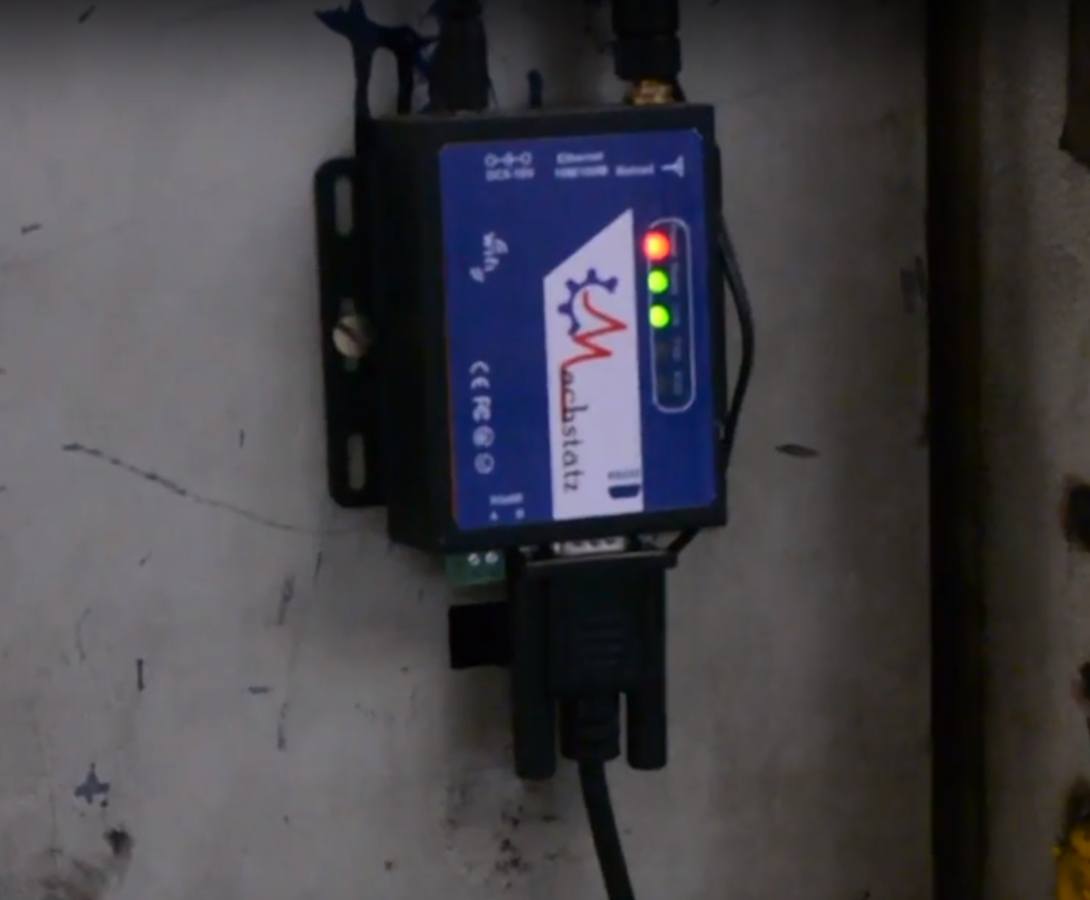
The first thing we did was install our industrial IoT gateway, which would transmit data from all of their machines. Once we finished our 10-minute setup, the platform started collecting data immediately. The venue soon started displaying data about the device running time and idle time, production efficiency, stroke count, pressure, temperature, production forecast, and many more.
Stanzen Engineering wanted to focus specifically on specific critical KPIs. We were more than happy to create a report with these KPIs for them.
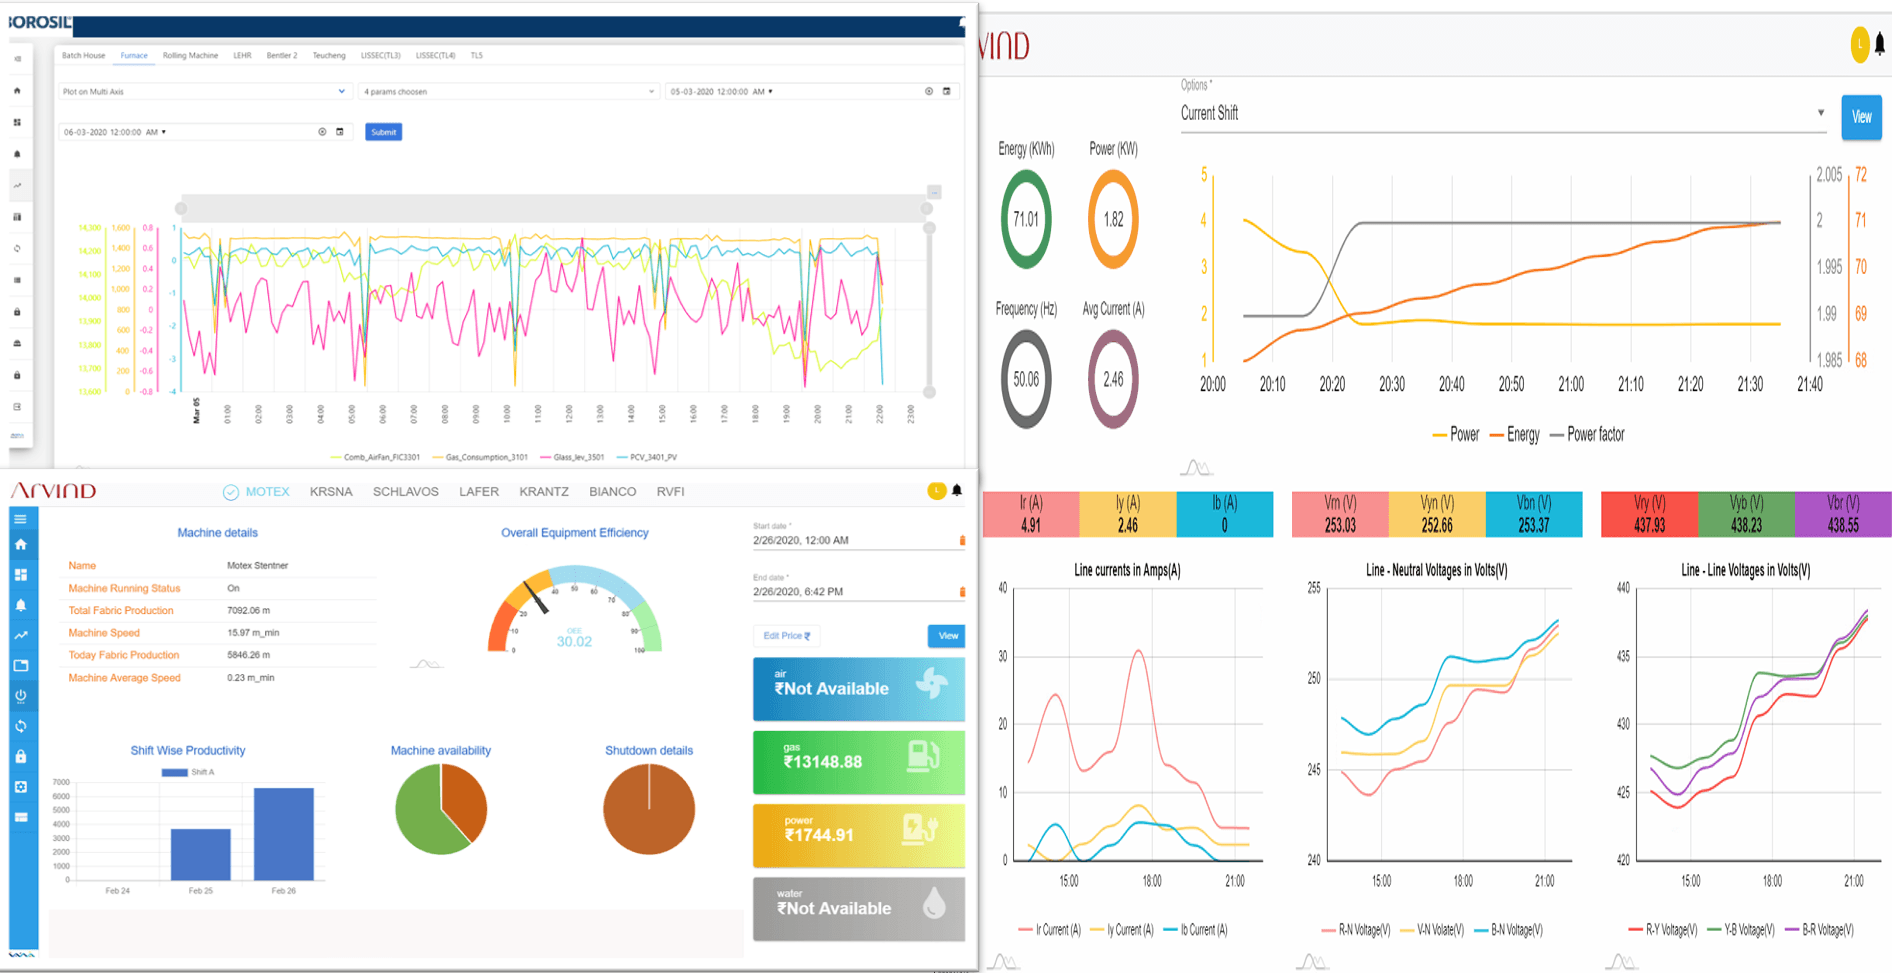
Overall Equipment Effectiveness (OEE) - To ensure their product quality is always on point and their machinery performs perfectly every time, we created this dashboard. Overall Equipment Effectiveness (OEE) is the gold standard for measuring manufacturing productivity. It shows as a percentage of the time. In short, it indicates the percentage of time a machine has been productive out of its total running time. It is divided into three parts:
- Quality - How often does the machine churn out optimum quality products? Is it producing any defective units? Do any of the teams require rework? A score of 100% indicates that 100% of the time, the machine has optimum quality products..
- Performance - How quickly is your machine producing products? Is your machine slowing down? Is your device running optimally? A score of 100% indicates that 100% of the time, the engine is processing products as fast as possible.
- Availability - How often do you suffer unplanned shutdowns? Are your machines running as planned? A score of 100% indicates that 100% of the time, your devices and processes are performing during the scheduled production time.
Furthermore, their maintenance team provided us with six months of machine runtime data. This data showed us the following failures:
- Misaligned Shaft
- Bearing Defects
We fed the six months data mentioned above, potential diagnosis, and the parameters in our AI algorithm. Additionally, our vibration sensors’ data indicated high levels of unusual vibrations and high temperatures. Then, our AI algorithm ran a correlation analysis between all these data sets, identifying patterns, and predicted further bearing defects.
We communicated this piece of information to the maintenance team, and upon verification, they confirmed that the parts had worn out. We were able to predict bearing wear accurately.
Actual vs Planned - This data shows the comparison between planned production and actual production. We have presented the expected information and the real data, shift-wise as well as week-wise. This segregation has been done to provide deeper insights to the users.
Production Forecast - Additionally, our predictive AI showed a predictive analysis of their machine health. This information included the number of days until each of the components of a machine would fail, their maintenance priority, and vibration levels (whether it’s normal or abnormal).
Results
By being able to monitor comprehensive production details in real-time, they were able to increase the operational efficiency of their entire plant by 30%, achieve production targets and successfully predict machine failures and save unnecessary costs.
And that’s not all. When the management compared the amount invested in our products and their savings in downtime costs, they found the ROI to be ten times their investment in Machstatz!
This way, we accurately predicted what component caused the recurring shutdowns, but we also identified why the part failed frequently. We removed costly guesswork and replaced it with an intelligent system that consistently warns them about imminent issues.
Products Used
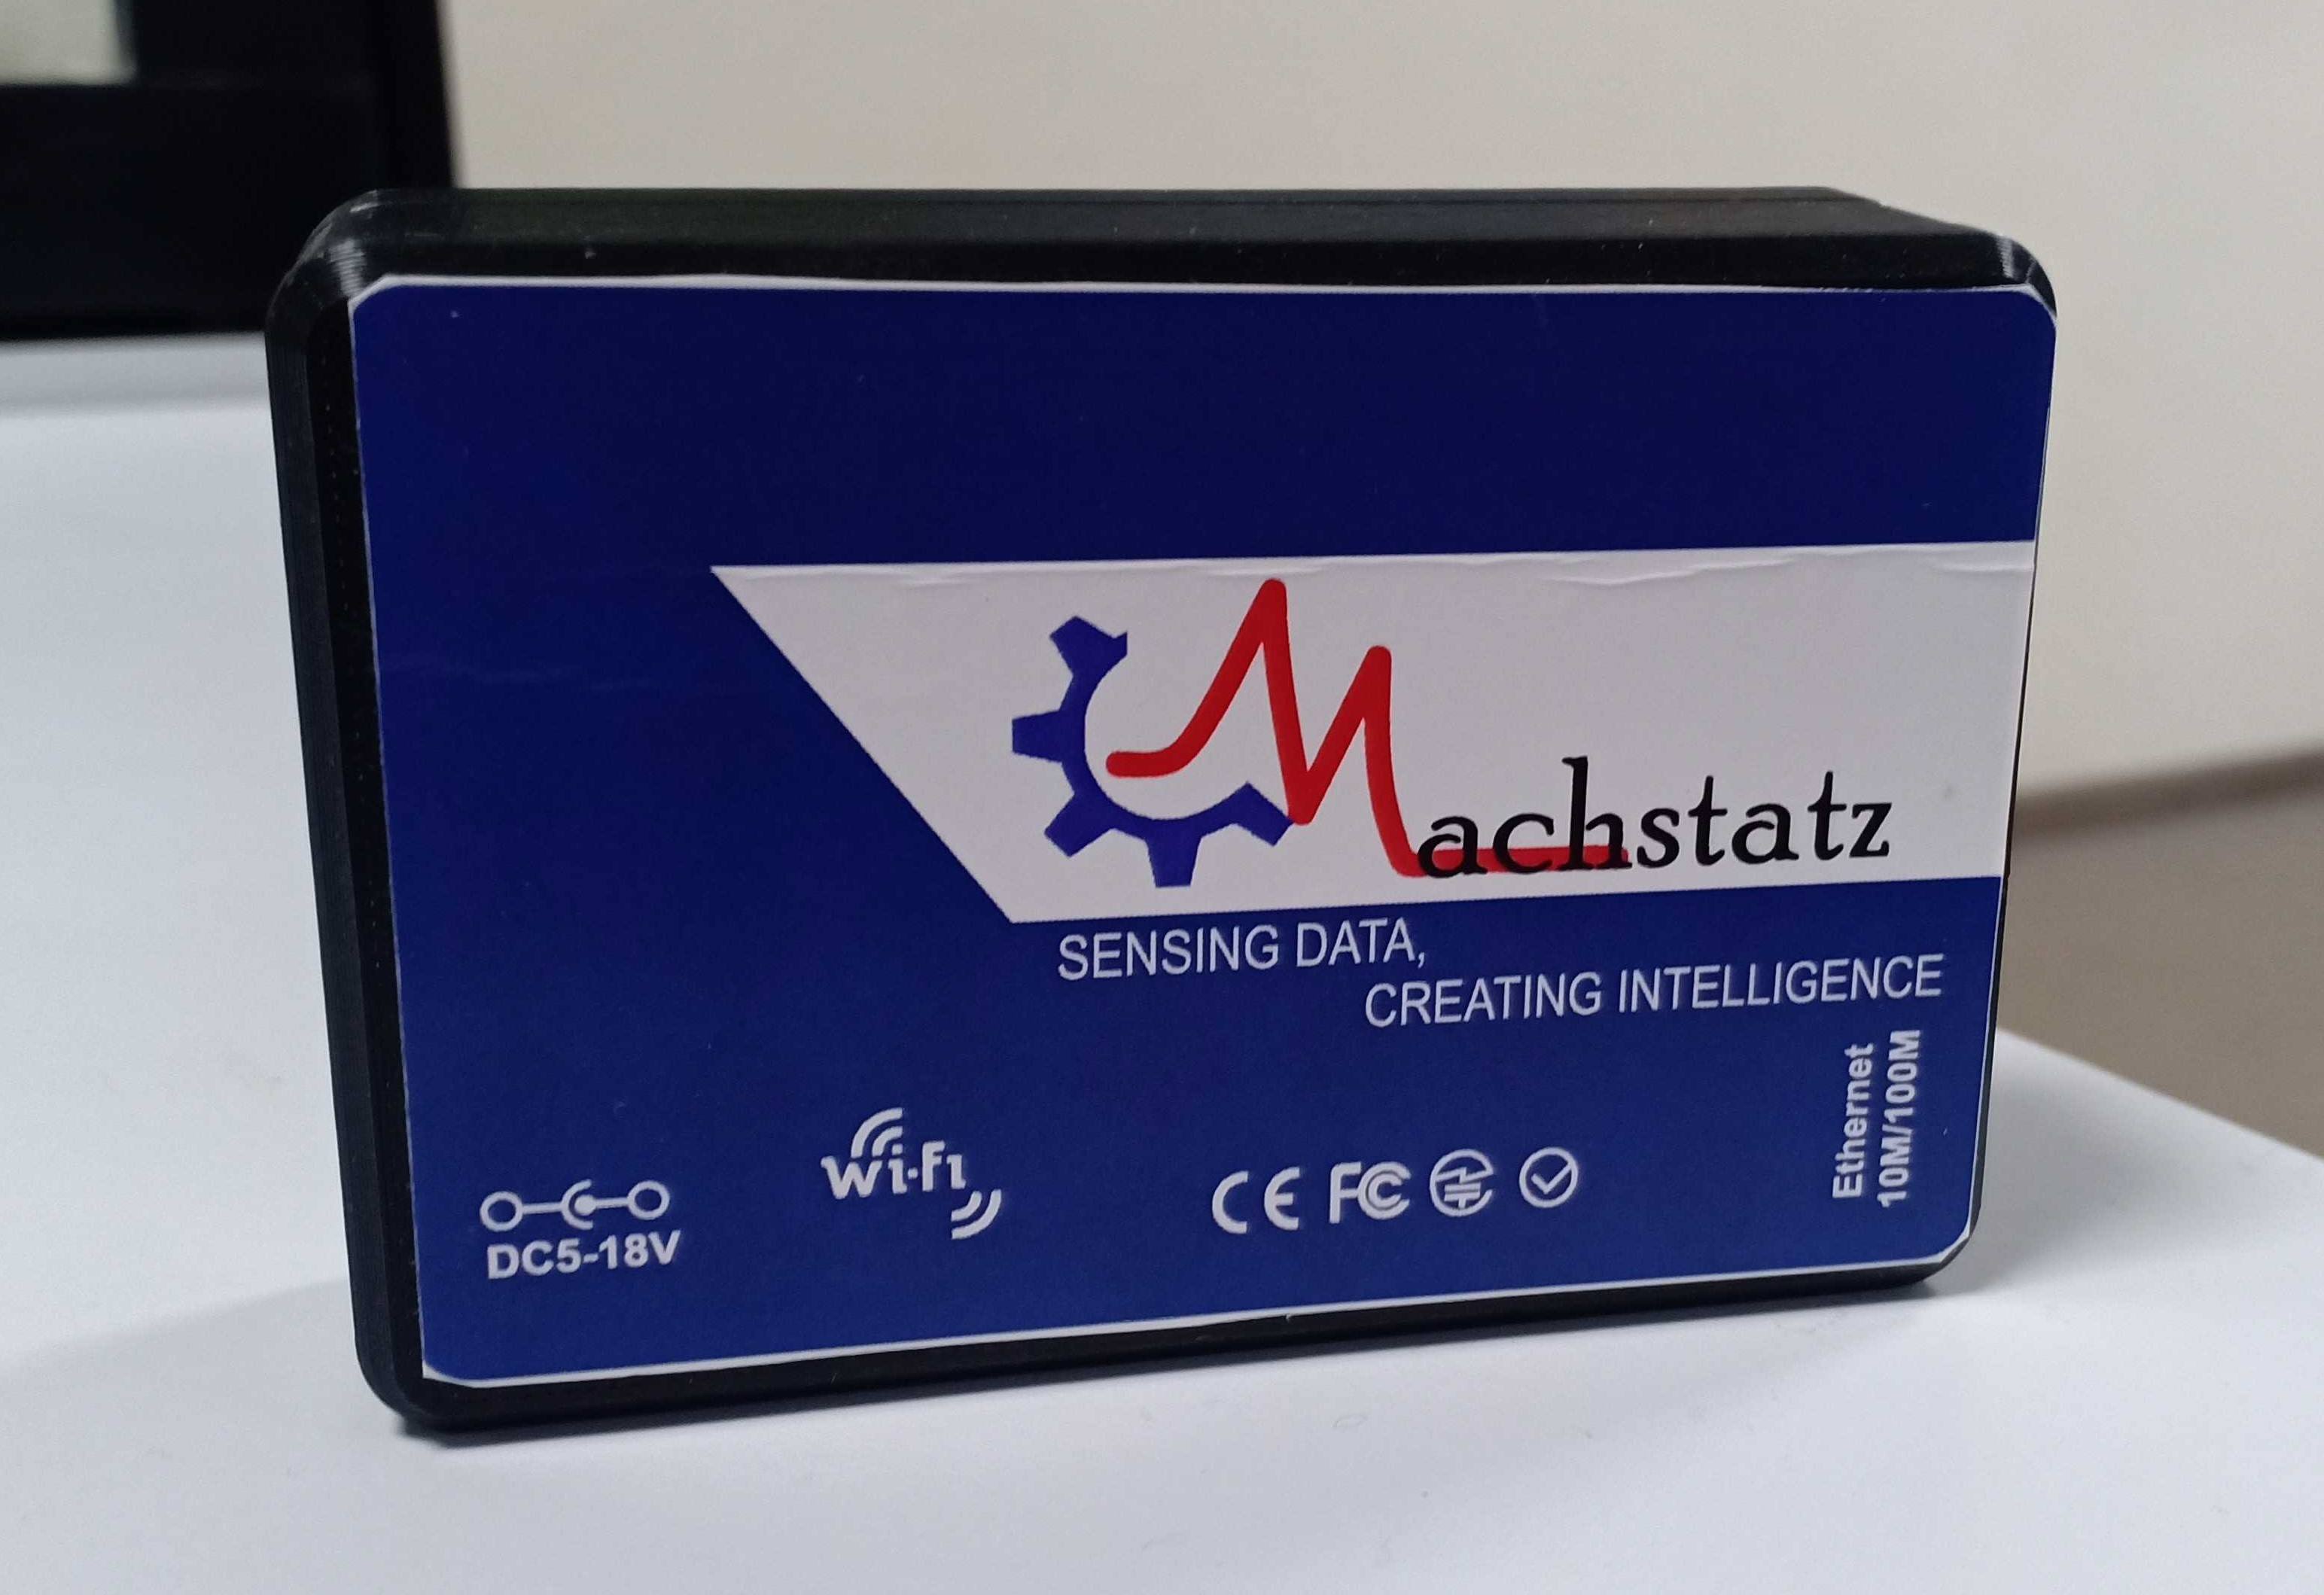
Integratred Industrial Gateway
Lucrys Analytics
Solution Used

Acute


A Chemical Manufacturing Plant successfully predicted and prevented 12 hours of machine downtime using pattern recognition and AI (a 10x ROI!)

Read more
Jindal Steel & Power Limited used our Lucrys Analytics Platform to connect their machines, track and improve the deviations in the manufacturing process on real time basis.
Read more